
Dashboard
The dashboard page summarizes the user's fund hedging information, including conversion, exposure, rate, and profit.
3/19/20252 min read
Dashboard Toolbar
Conversion Section

The dashboard contains a card-sized conversion navigation bar. Clicking the card will redirect the user to the conversion page with a preset filter.
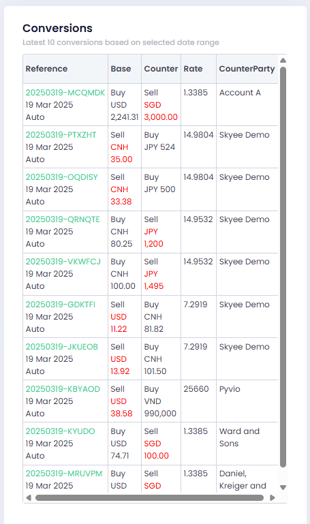
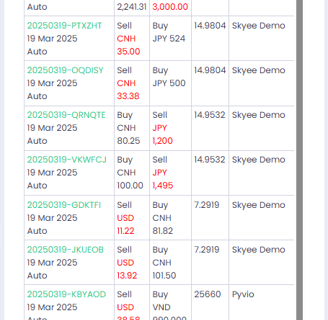
The conversion table lists the latest 10 conversions based on the selected date range. Clicking the reference column redirects the user to the conversion detail page.
The collapsible Monthly Conversion GTV graph displays the total Gross Transaction Value (GTV) amount. The graph is filtered by a specific year, and clicking on a bar reveals the GTV amount by currency for the selected month.
Profit Section
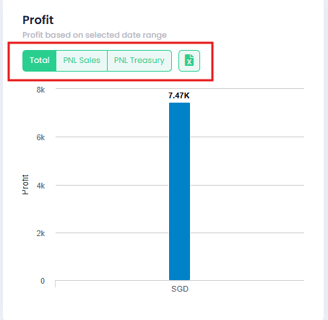
The Profit graph displays the profit amount in the selected date range. The graph offers a feature to export the profit's raw data and three types of filters. Notably:
Total profit
Profit and Loss (PNL) Sales
PNL Treasury

The Monthly Profit Trend graph displays the profit amount by month. The graph offers an identical filters as the Profit graph, and it is filtered by a specific year. Clicking on a bar reveals the profit amount by currency for the selected month.
Exposure Section
The Exposure graph displays the total exposure amount by currency. Clicking on a bar reveals the exposure amount for each currency pair of the selected currency.
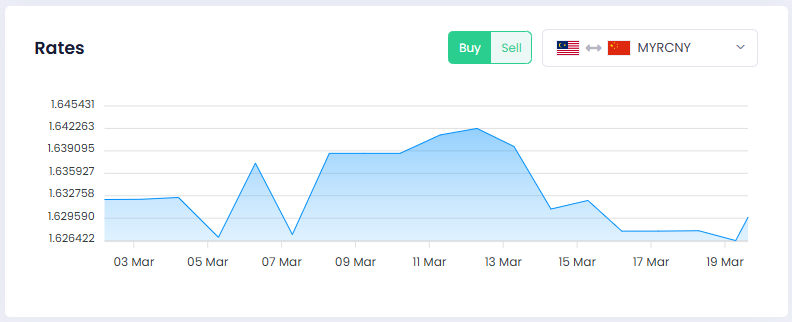
Rate Section
The Rate graph displays either the buy (bid) or sell (offer) currency rate for the selected currency pair and date range.

Get in touch
Narwhal Financial Systems Pte. Ltd.
60 Paya Lebar Road, #07-54 Paya Lebar Square, Singapore 409051
Once submitted, you have agreed to our privacy & cookies policy.
© 2021 - 2025 NARWHAL FINANCIAL SYSTEM. ALL RIGHTS RESERVED.